Scanning Electron Microscope (SEM) is an essential tool for investigating the microscopic morphology of handcrafted paper, enabling the detection of fine fibre structures and surface characteristics. Handcrafted paper is examined using the NANOS tabletop SEM in both low and high vacuum modes. Additionally, Energy-Dispersive X-ray Spectroscopy (EDS) was employed to analyze the elemental composition of the paper.
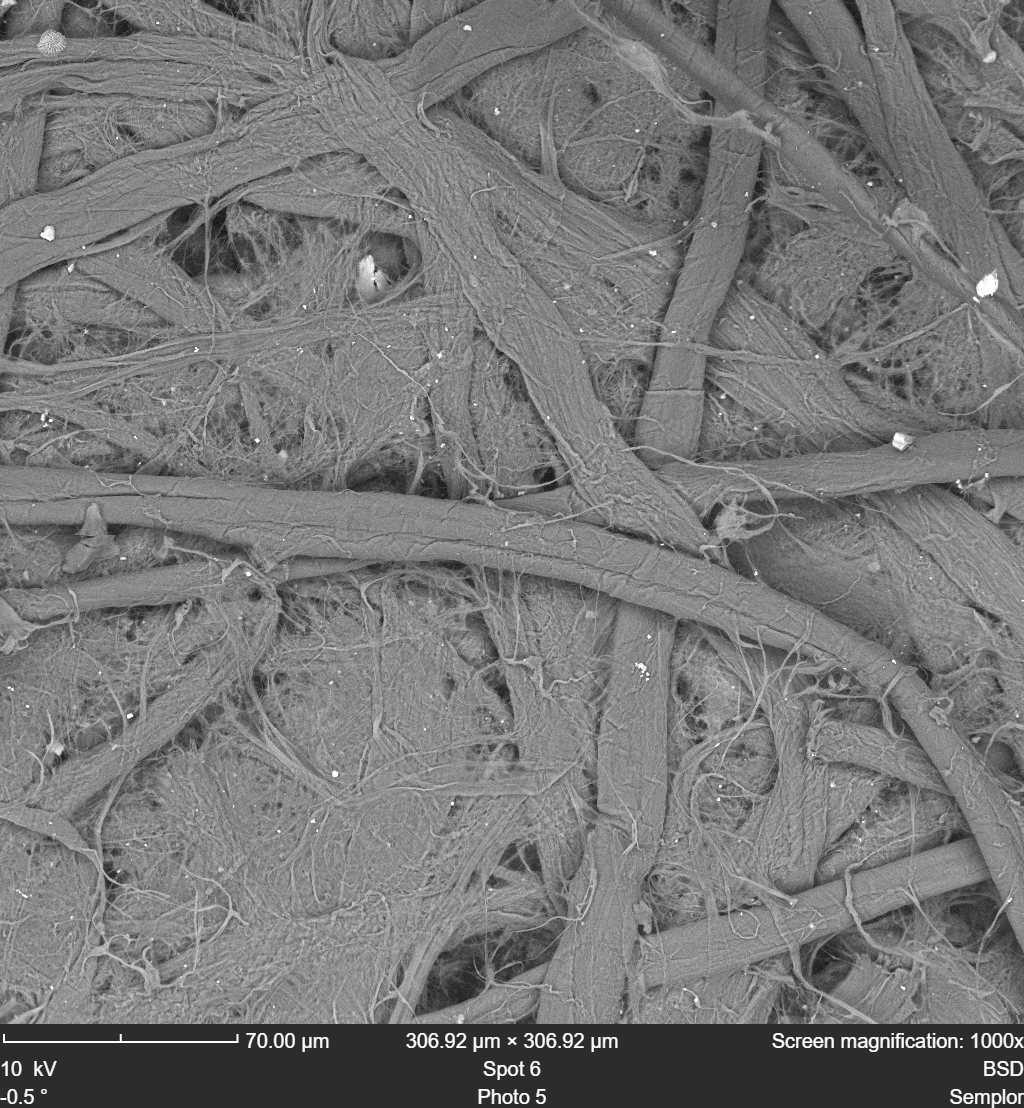
Figure 1 illustrates handcrafted paper observed under low vacuum conditions without gold coating, imaged in BSD mode. The uncoated handcrafter paper has extensive fiber detail and intricate textures, highlighting the natural fiber arrangement and porosity inherent to handcrafted paper. The low vacuum mode proves to be highly effective in capturing the authentic microstructure of the paper, showcasing fiber junctions and irregularities that contribute to its unique quality.
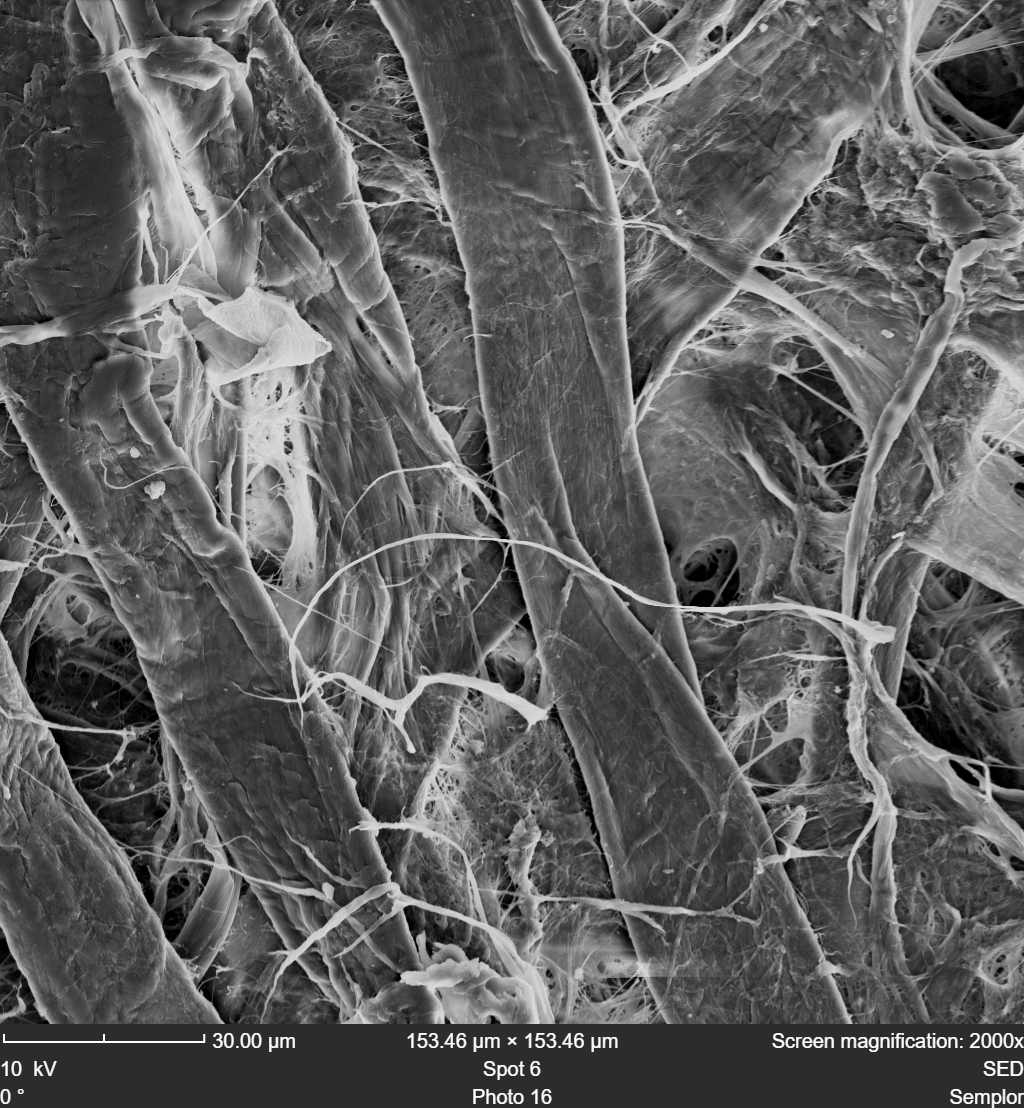
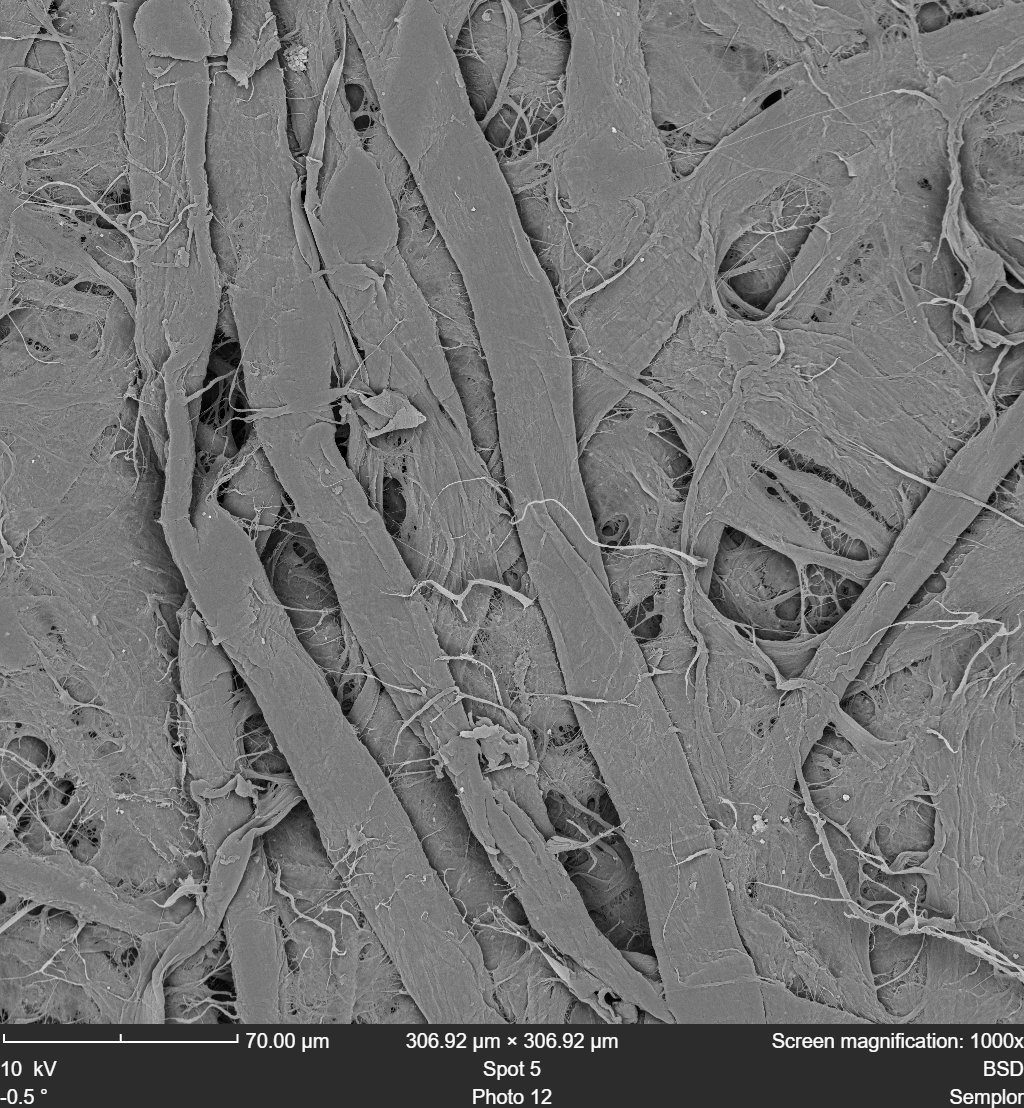
Coating the handcrafted paper in a 5nm layer of gold presents the ability to look at the paper in SED mode, which provides more surface detail in comparison with BSD, as can be seen in Figure 2. This additional surface detail allows for the identification of finer fiber structures and subtle surface irregularities that are not as easily discernible in BSD mode (see Figure 3).
Figure 2 - SED image of handcrafted paper in high vacuum mode coated in 5nm gold, highlighting finer fiber structure and surface information.
Figure 3 - BSD image of handcrafted paper in high vacuum mode coated in 5nm gold
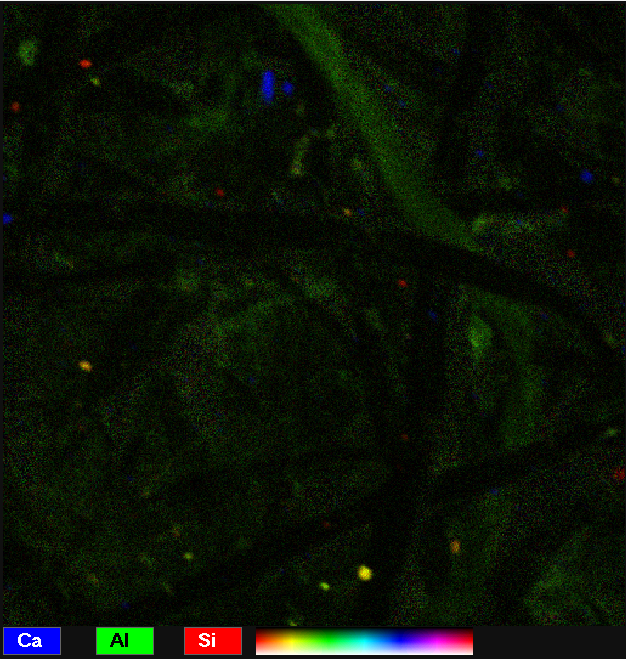
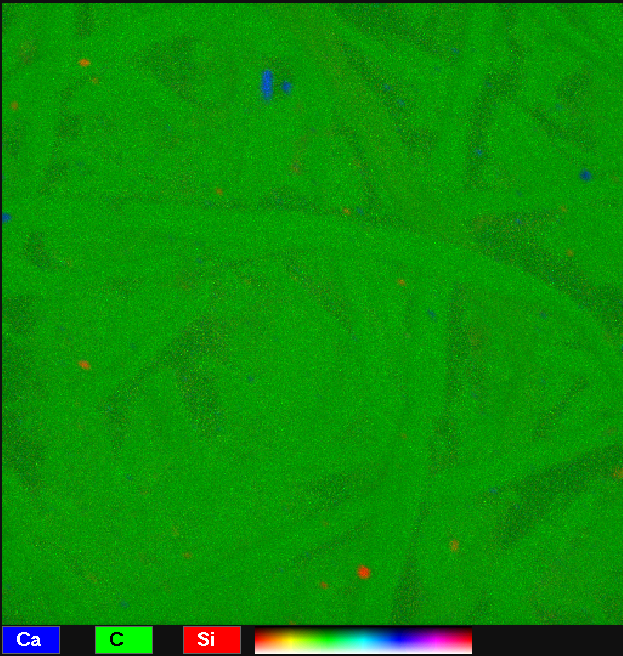
Figures 4 and 5 display EDS maps of the handcrafted paper. The elemental composition is predominantly carbon, consistent with the cellulose-based nature of the paper. Additionally, localized spots of calcium (Ca) and silicon (Si) were detected. These elements are likely derived from additives used in the paper-making process, such as calcium carbonate for brightness and silica-based fillers. Aluminium can be found throughout the whole surface this can be derived from alum-based sizing agents to enhance surface properties.
Figure 4 - EDS map of handcrafted paper, indicating the presence and distribution of calcium (blue), silicon (red), and aluminium (green) within the sample.
Figure 5 - EDS map of handcrafted paper, indicating the presence and distribution of carbon (green), calcium (blue) and silicon (red) within the sample.
Figure 1 - BSD image of handcrafted paper in low vacuum mode without coating, highlighting detailed fiber arrangement and natural surface texture.