Asbestos fibres detection and quantification with TT-SEM+EDS
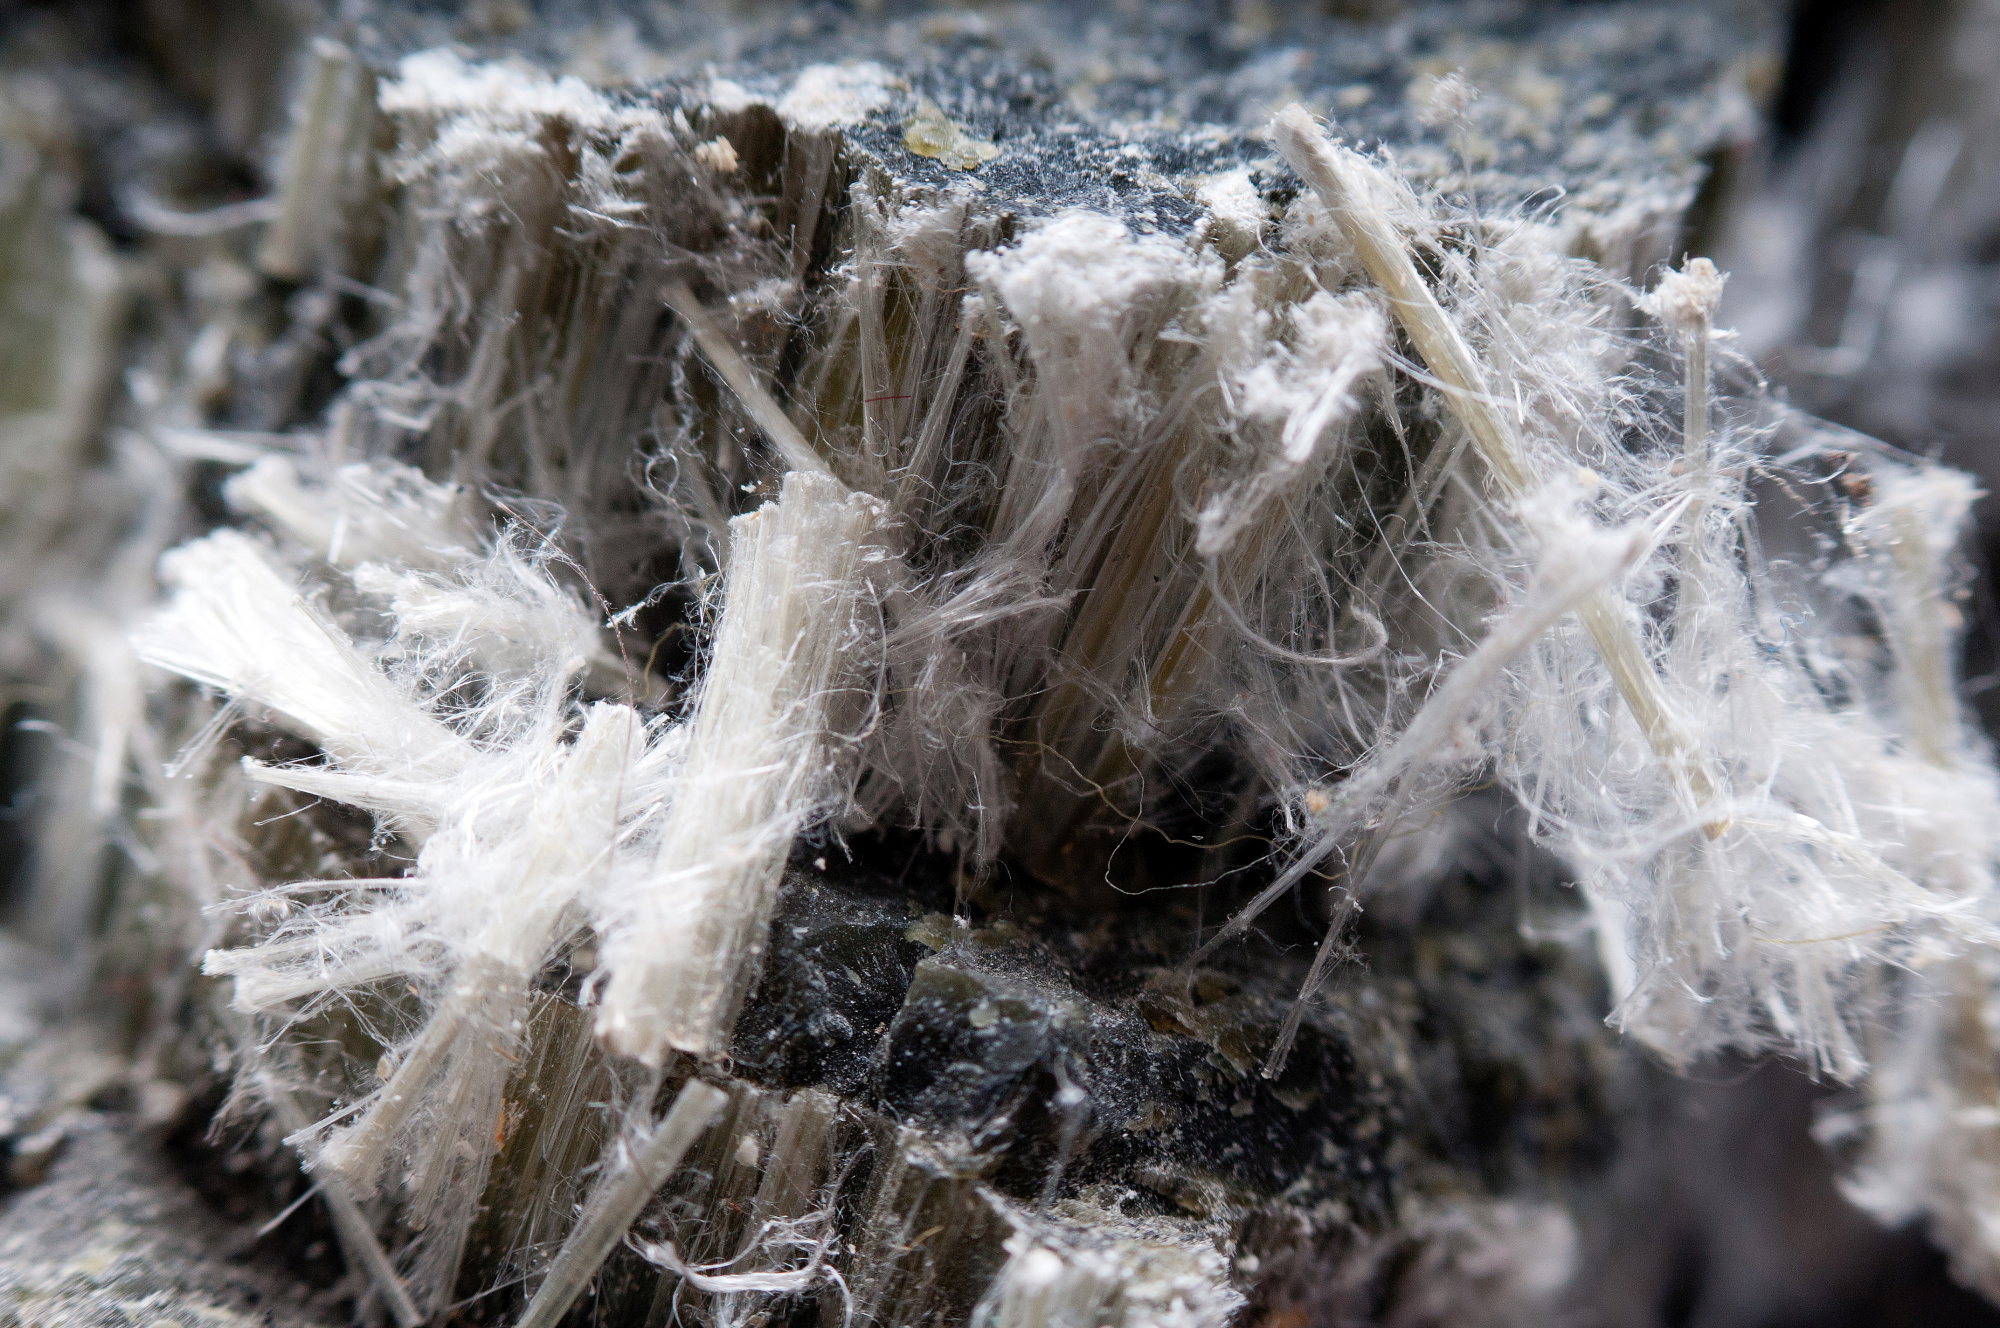
“Asbestos” is not a single chemical entity but is the name for a group of six hydrated fibrous polysilicates which occur naturally and consist of fine, microscopic fibres. Asbestos was mainly used by in the past as a building material and this has caused the spreading of asbestos in the air, soil, and water. Asbestos fibres were found to be highly toxic in the first half of XX century and their use was banned from use in Europe and USA between late 1980s and early 1990s.
Since the toxicity of asbestos appears to be related primarily to fibre size, modern analytical methods focus on providing information on these parameters, as well as on total number of fibres and mineral type. At present, the number and size distribution of fibres in a sample can only be determined by direct microscopic examination. This may be performed using either light or electron microscopy.
Even though light microscopy has been used for longer than electron microscopy, the latter can provide much more in-depth information about the presence, composition, and quality of asbestos fibres in samples.
Tabletop scanning electron microscopes (TT-SEMs) with integrated elemental analysis can easily detect asbestos fibres in samples and identify the mineral type using energy-dispersive X-ray spectroscopy (EDS).
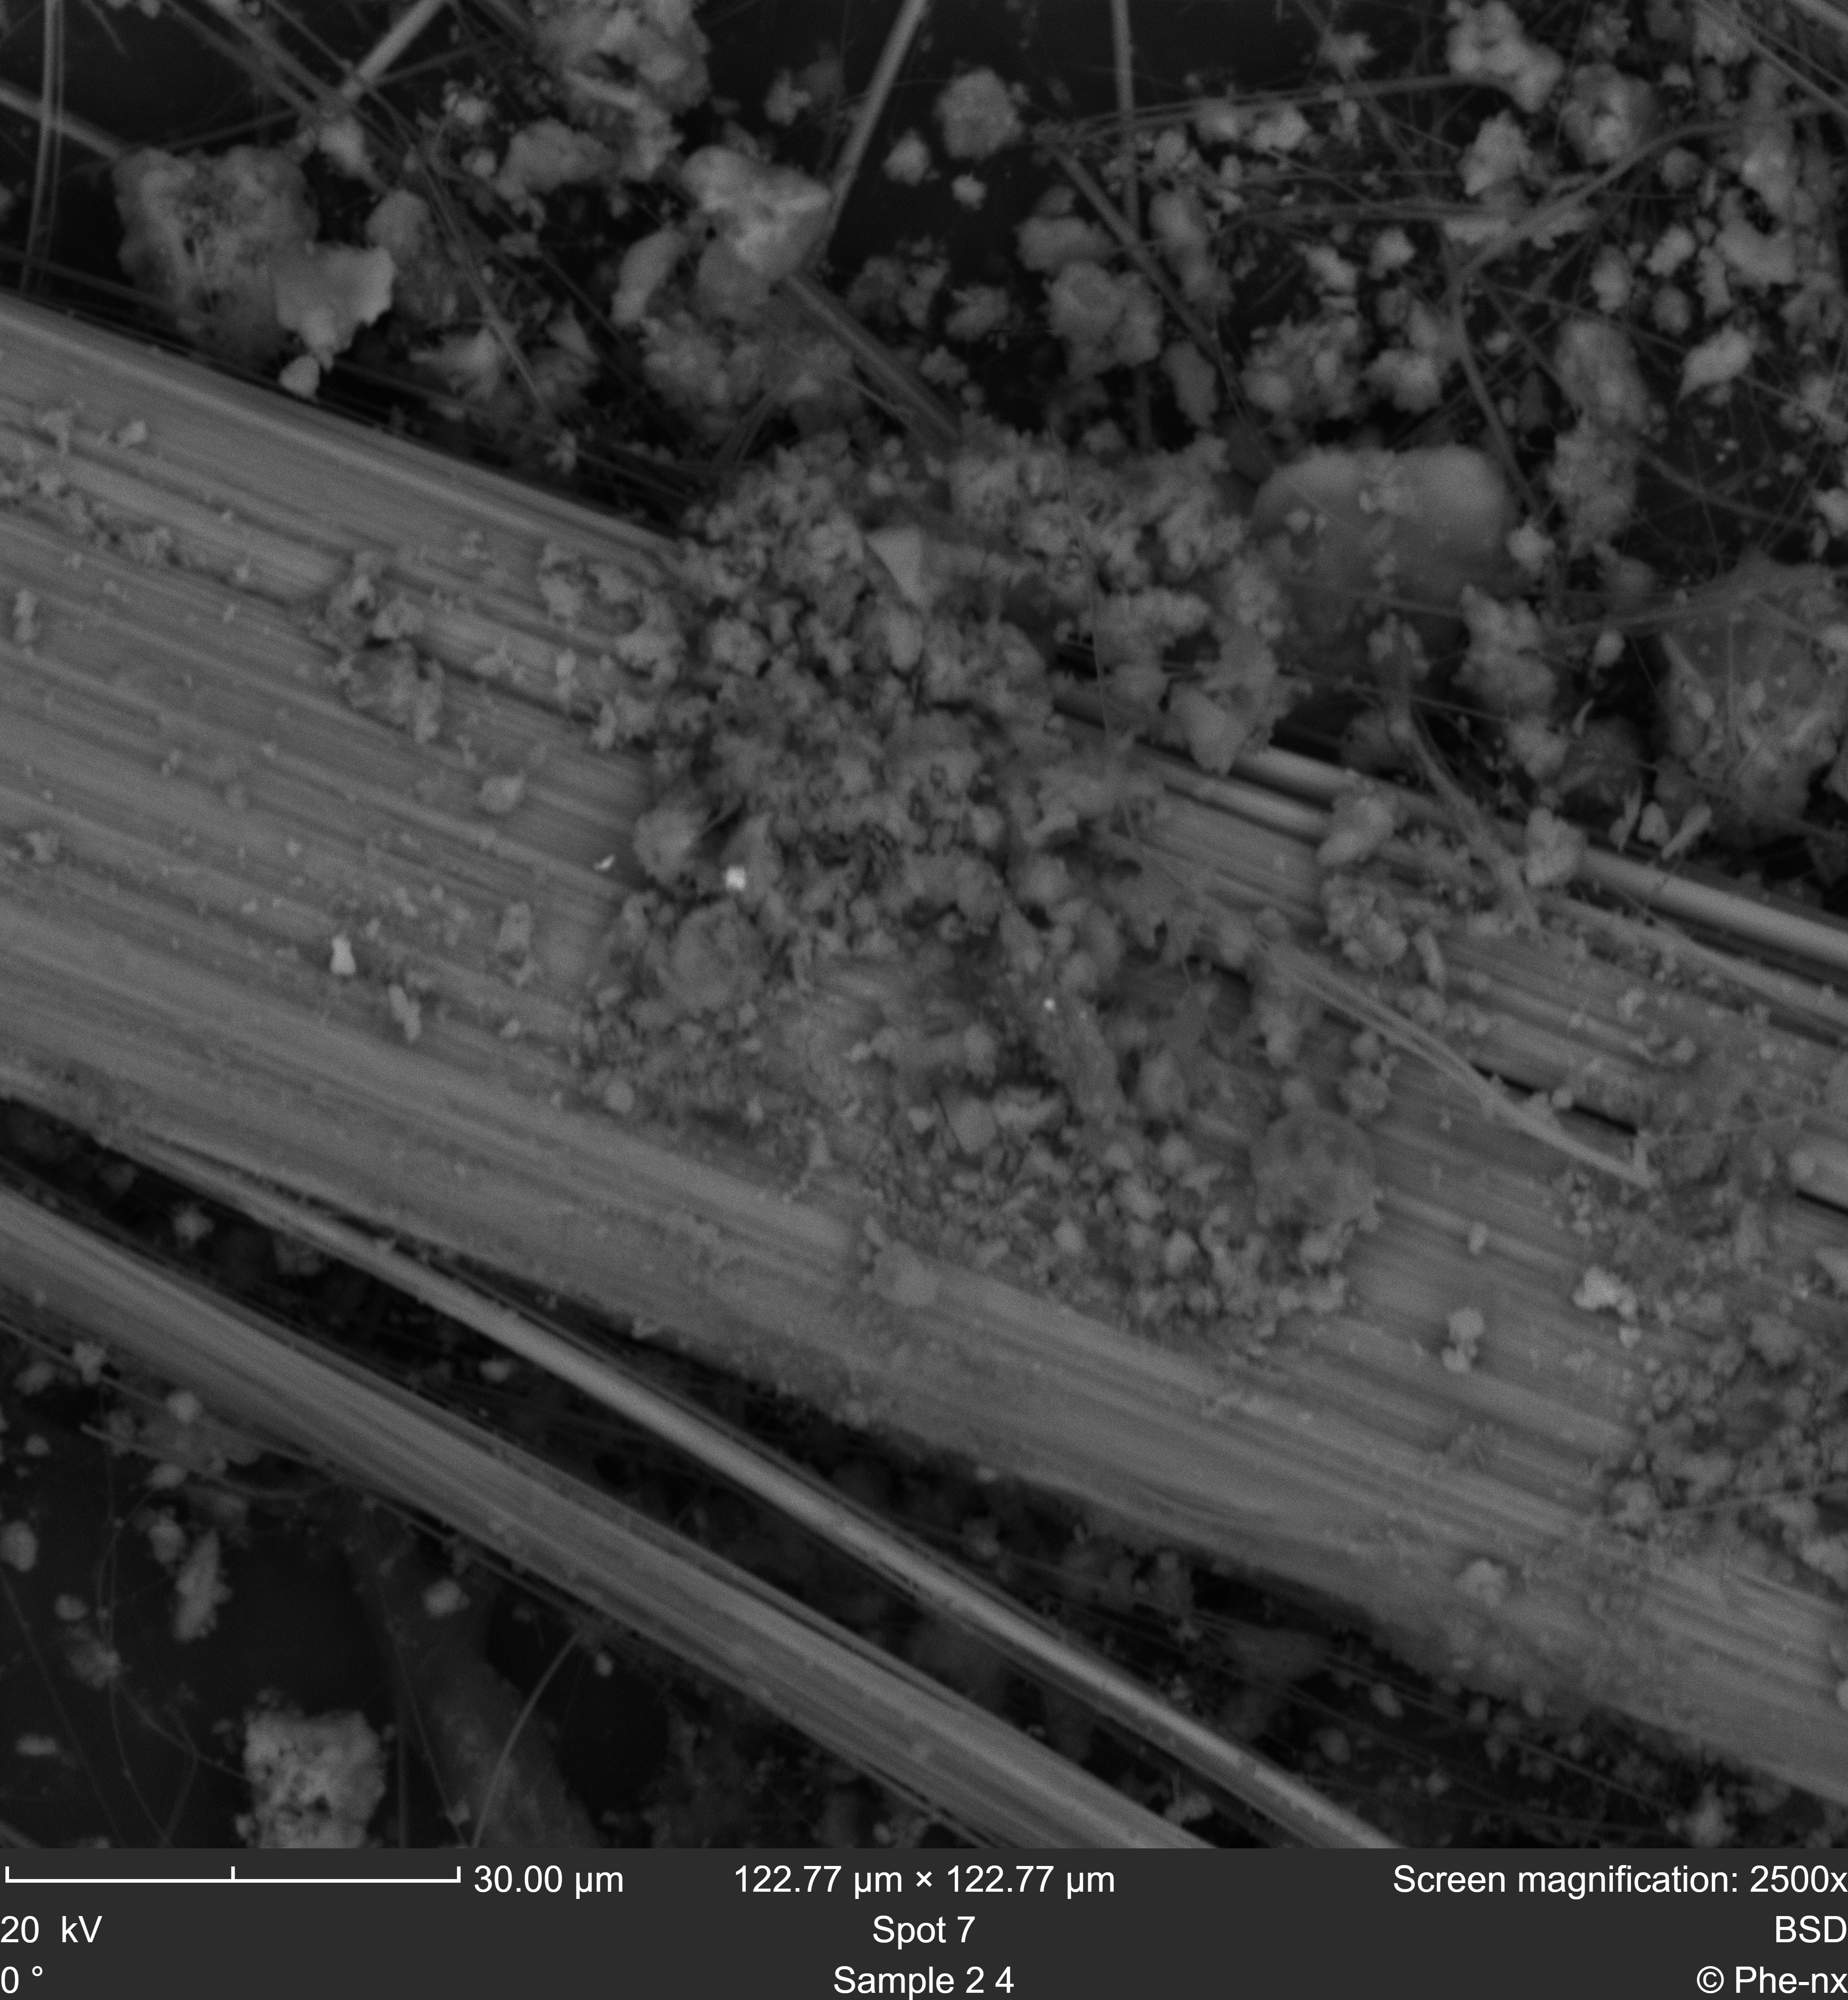
Figure 3 - BSD image of asbestos fibres in a fibre cement sample.
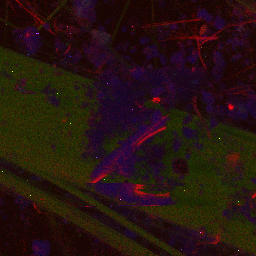
Figure 4 - EDS map of asbestos fibres in a fibre cement sample. Chrysotile and crocidolite fibres can be clearly distinguished from their composition: the former contain magnesium (red) while the latter contain iron (green). The calcium-based cement matrix is coloured in blue.
The seamless integration of SEM imaging and EDS mapping in modern tabletop SEMs allows for faster analysis of samples containing even small amounts of asbestos fibres. Since asbestos was widely used in insulating materials, the ability to work with non-conductive samples is required to operate in this field. The Semplor NANOS TT-SEM offers both a low-vacuum mode and a cutting-edge BSE detector to acquire sharper images of conductive and non-conductive samples at any voltage setting, either at 10 kV for more surface-sensitive imaging or at 20 kV for the best resolution and EDS analysis. The counting of asbestos fibres after their identification is made easy by the high contrast between the fibres and the rest of the samples, guided by the EDS maps which provide the required mineral identification.
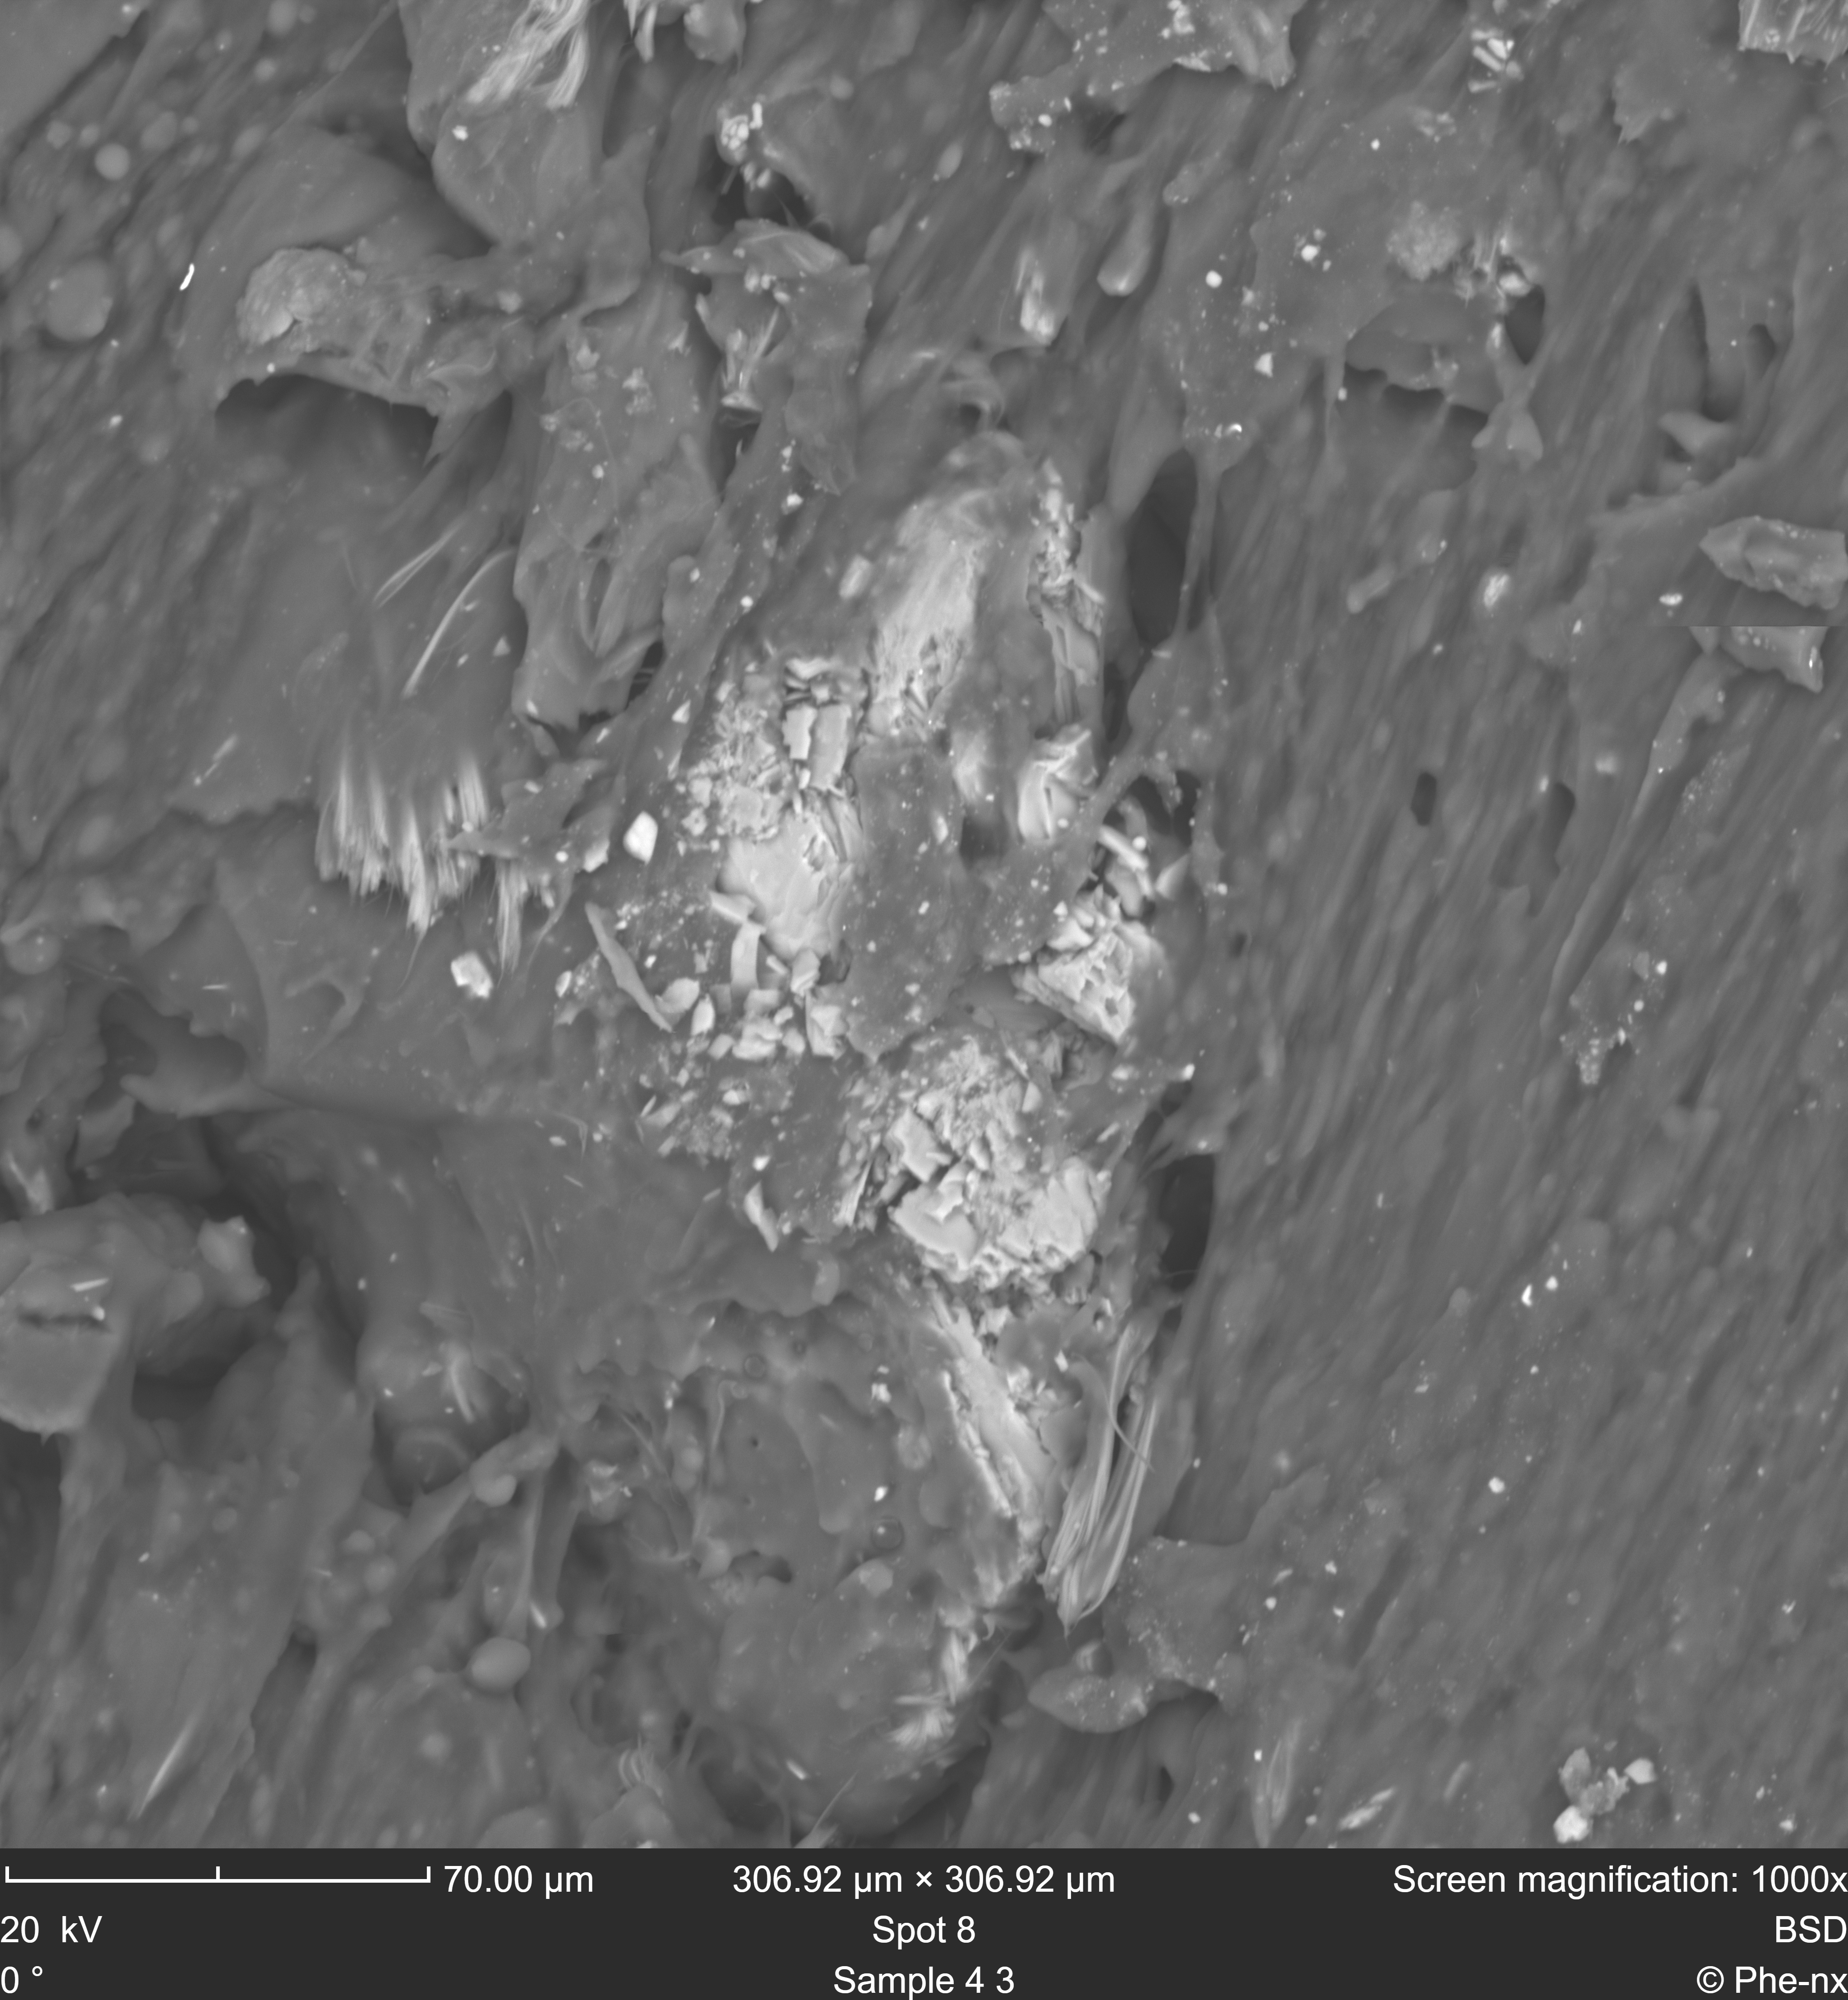
Figure 5 - Asbestos fibres and non-fibrous inclusions embedded in insulating rubber. The BSD image shows surfacing mineral residues.
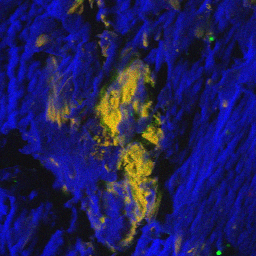
Figure 6 - The surfacing mineral residues are identified with this EDS map: both fibrous and non-fibrous magnesium silicates (Mg: red, Si: green, magnesium silicates: yellow) are detected amidst the rubber matrix (blue).
Figure 1 – Asbestos
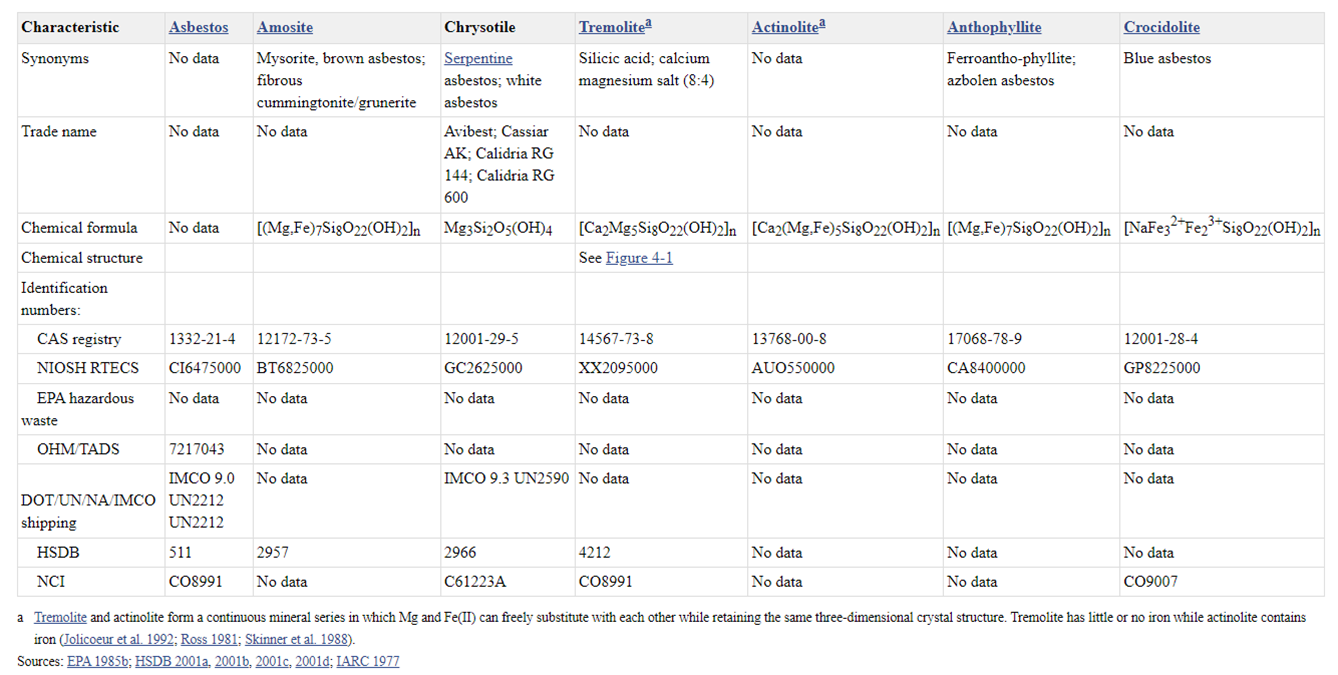
Figure 2 – Chemical identity of asbestos (Toxicological Profile for Asbestos, Atlanta (GA): Agency for Toxic Substances and Disease Registry (US); 2001 Sep.)